
 Facebook
 X
X
 Pinterest
 Copy Link
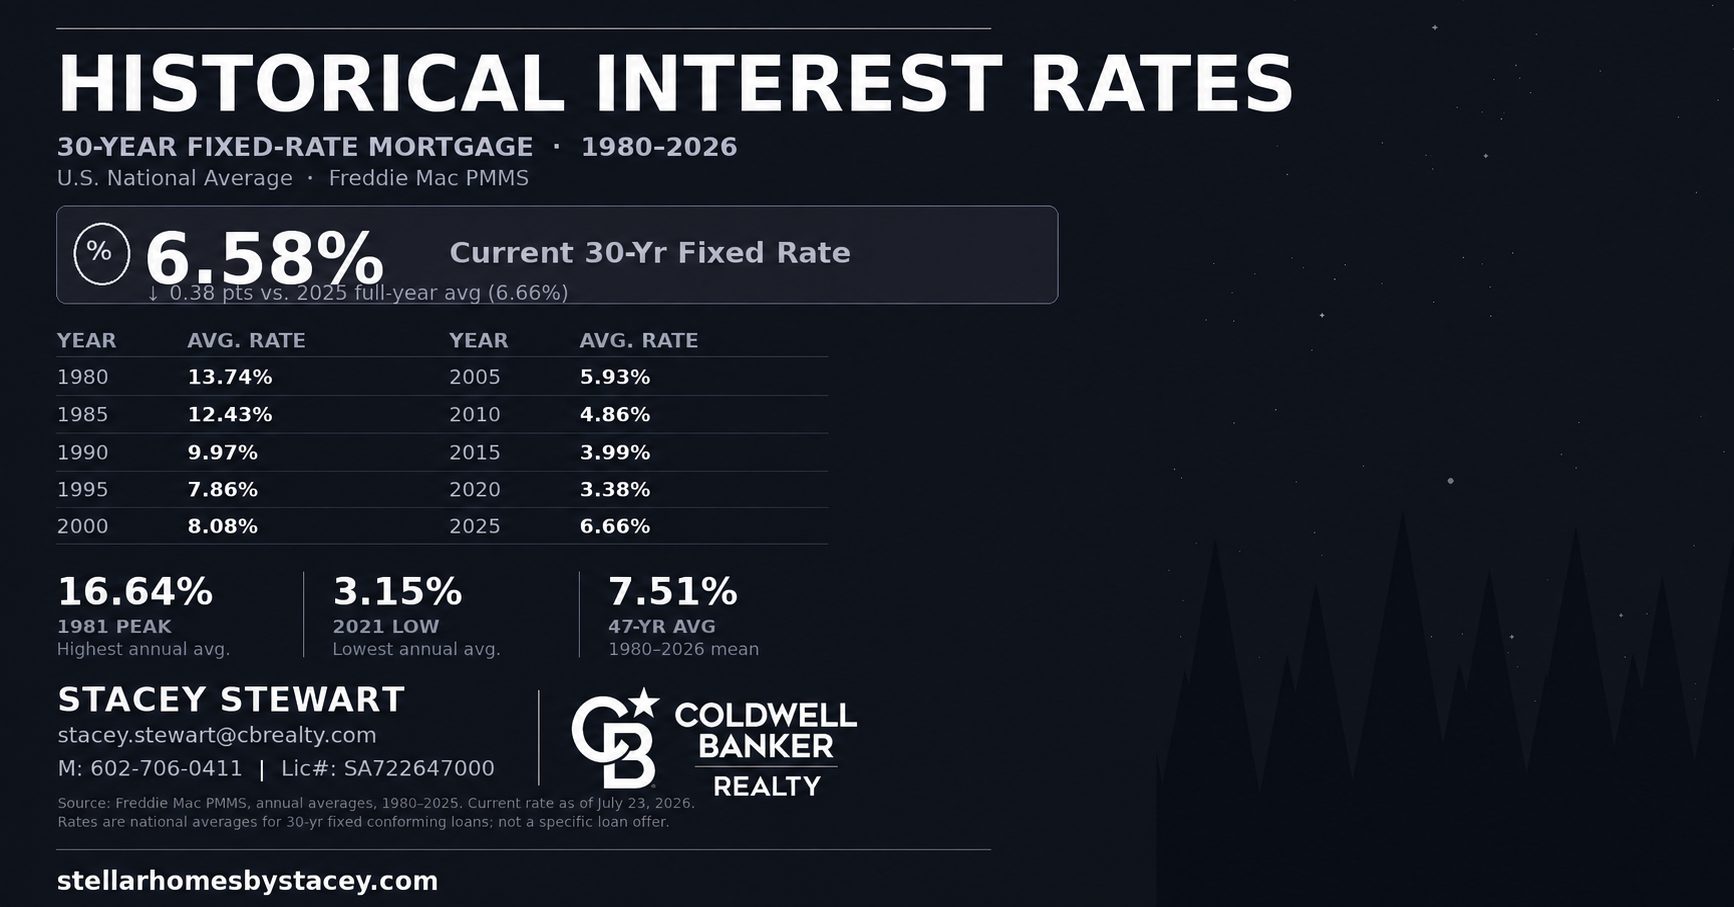
Part 1 of 2 — On Tuesday, I’ll dig into what this means specifically for buyers here in Metro Phoenix.
The chart above is jarring, right?
If you’re holding off on buying a home because today’s mortgage rates feel high, you’re not alone, but you likely are a victim of “recency bias”.
A look back at where rates have actually been puts today’s market in a very different light, and helps explain why so many buyers who wait for “perfect” conditions end up waiting far longer than they expected.
Where We’ve Been
Mortgage rates haven’t always hovered in the comfortable 3-4% range many buyers remember from a few years ago. In the 1970s, rates climbed steadily from around 7% into the double digits by the decade’s end, driven by rampant inflation. Then came the early 1980s, when the Federal Reserve, under Chairman Paul Volcker, raised rates aggressively to break inflation’s grip. The result: 30-year mortgage rates peaked at an eye-watering 18.63% in October 1981. An entire generation of homebuyers financed their homes at rates that would be unthinkable today.
From there, rates trended
broadly downward for decades — falling to around 8% by the early 2000s, then down to roughly 5.4% by 2009 as the Fed responded to the financial crisis. The 2020 pandemic pushed rates to historic lows, bottoming at 2.65% in January 2021. Those rates were the exception, not the rule — a once-in-a-generation anomaly created by emergency monetary policy, not a baseline anyone should expect to return to.
Where We Are Now
As of late July 2026, the average 30-year fixed mortgage rate sits in the mid-to-high 6% range (roughly 6.6-6.7%, depending on the lender), after briefly dipping to a 2026 low of 6.01% in February. Viewed against the last 50 years of data, that’s well within historical norms — in fact, it’s below the 50-year average.
Why Waiting Rarely Pays Off the Way Buyers Expect
It’s tempting to sit on the sidelines hoping rates drop further. But a few realities are worth weighing:
Home prices have historically risen over time, and that appreciation often outpaces the savings from waiting for a slightly lower rate. A buyer who waits a year for a half-point rate improvement may find the home they wanted now costs significantly more — erasing any savings and then some.
Rates are not fixed forever. If you buy now and rates fall later, refinancing is a well-established option. But if you wait for lower rates and prices climb in the meantime, there’s no equivalent way to “refinance” a higher purchase price.
Every month spent renting or waiting is a month without equity building in your name. Even in a higher-rate environment, homeownership starts that process; delaying only pushes the starting line further out.
Rate predictions are notoriously unreliable. Economists and analysts have been forecasting rate drops for years with mixed accuracy. Building a home-buying timeline around a specific future rate is a bet, not a plan.
The Bottom Line
Today’s rates may not feel as low as the pa
ndemic-era lows, but they’re far from historic highs, and history shows that rates are cyclical, not static. Rather than trying to time the market perfectly, the more reliable approach is to buy when the home and your personal finances make sense, and revisit your rate later if conditions improve.
Tomorrow on the blog: what a decade of Phoenix-area appreciation looks like next to what buyers actually pay in mortgage interest — and why local numbers make an even stronger case for not waiting.
This article is for general informational purposes and reflects publicly available rate data as of July 2026. It is not personalized financial or lending advice — for guidance specific to your situation, I’d always recommend speaking with a licensed lender.
Data notes: annual averages are Freddie Mac PMMS figures (1980–2026), 2026 is year-to-date through July 9, and the “current rate” (6.58%) is the latest weekly PMMS reading as of July 23, 2026. All sourced from Bankrate’s mortgage rate history page, which compiles Freddie Mac’s data.
Sources:
